‘WEIRD’, A Free Range Journal – Issue No.3, Samhain 2020:
Britain’s Energy & Climate Crisis
A special third edition, investigating ‘Britain’s Energy & Climate Crisis’, to demonstrate that neither side in this heated debate cares about statistical reality, or its deeper meaning.
Download this edition
1A4 PDF – for printing at A4 single- or double-sided; or
2A3 PDF – for printing landscape A3 double-sided to create a folded/stapled brochure.
‘WEIRD’ is designed to print at A4, but will reduce to A5 and be about the same size as small newsprint. The A3 PDF will scale for double-sided A4 landscape
Issue No.3 Contents:
- Introduction – ‘Britain's Energy & Climate Crisis’
- Introducing this special third edition, investigating ‘Britain’s Energy & Climate Crisis’, to demonstrate that neither side in this heated debate cares about statistical reality, or its deeper meaning.
- ‘Data shows the single most effective measure to reduce carbon emissions quickly is a global recession’
- We start at the most controversial beginning; a truth locked within the data that mainstream campaign groups refuse to discuss.
- An Energy History of Britain
- The history of energy in Britain is a catalogue of failure, from decisions that ignore ecological reality.
- Home Energy Use – ‘Domesticity’ breeds confusion
- The media focus on domestic energy; it doesn’t amount to much, and so distracts from other parts of the economy.
- Renewable energy – An ‘uncontested good’
- Everyone loves renewable energy, don’t they?; but few really understand its relative scale of its contribution to energy supply, and certainly not the sometimes gruesome details of its production.
- The scandal of the ‘green’ biofuels that damage the Earth
- Calling it ‘renewable’ doesn’t make energy sources ‘ecologically’ sound.
- Has ‘Green’ gone wrong? – Shifting the debate on energy & climate change
- The film ‘Planet of the Humans’ caused a storm in green circles. What they failed to realize was the character of their response actually accentuated the film’s arguments.
- Energy follows lifestyle – Where does it all go?
- What the national energy statistics do not fully capture is lifestyle – and how lifestyle influences emissions. Common sense says we must create our own ‘lifeboat’ options instead.
- ‘Do you want to live, or do you want to watch Netflix?’ Yes, it really is that simple.
- Concluding the ‘energy special’, what can we understand about Britain from its energy data?
Introduction – ‘Britain’s Energy & Climate Crisis’
Introducing this special third edition, investigating ‘Britain’s Energy & Climate Crisis’, to demonstrate that neither side in this heated debate cares about statistical reality, or its deeper meaning.
This is not the ‘WEIRD No.3’ we’d planned. Each year the Free Range Network produce a display to Etake to festivals. At its core is a presentation on energy and the environment that explains the background to the figures that government, the media, and campaign groups often quote in public.
This year, no festivals. Do we skip a year, or recycle the information we’d already put effort into producing in some other way? Hence the motivation for this ‘special statistical edition’, outside the themes we had originally planned.
Why are the UK’s energy statistics so interesting? They tell you not only how Britain’s society and economy functions, but also about the bias of those who run it or want to change it. Knowing the detail about the trends behind the numbers lets you test the quality of the debate, and the alternatives proposed.
It’s easy to criticize politicians for being stupid and ill-informed. The reality is those who oppose them on our behalf don’t do much better. They too are trapped within the biases of the economic and technological mainstream, which limit what ‘facts’ they will discuss, or what alternatives they will propose.
The ‘green furore’ of the recent film ‘Planet of the Humans’ (see article 7 later) shows ample evidence of that.
For example, many mainstream environmentalists ignore the unpleasant reality of how the figures often contradict the message they’re trying to deliver (see article 5 later); and thus how their message is compromised, and will clearly never work in practice because of their ignorance of such contradictions.
Problem is, by following the data, you necessarily end up with controversial conclusions. That’s because the data forces acceptance of difficult realities, and meaningfully changing those trends inevitably means addressing deeply engrained economic or social habits.
“Just the fact that we seem to think that the climate crisis can be solved by only adopting a green stimulus plan, or a green recovery plan, tells you everything you need to know about the general lack of awareness that exists today”
Greta Thunberg speaking to the BBC’s Justin Rowlatt, broadcast 25th June 2020
It is only by understanding how the system works that we can truly hope to change it; and if there’s one thing the popular debate demonstrates, it’s that those involved are talking about anything but the major trends that matter here: Affluence and consumption.
In 1975, the British economist Charles Goodhart said, “Any observed statistical regularity will tend to collapse once pressure is placed upon it for control purposes.” That was echoed by anthropologist Marilyn Strathern 20 years later: “When a measure becomes a target, it ceases to be a good measure.”
Today, that’s what carbon targets are.
In a society that idolizes technology, and its use to control or cure the ills of society, the adoption of simplistic technological measures is distracting people from the causes of those problems – the aforesaid affluence and consumption.
Right now there is no national policy on addressing ecological breakdown which does not rely, in some way, on technology or big construction agendas. When we look at the effectiveness of these systems they cannot possibly solve the problems they are designed to address; they tinker with the system as it is rather than changing the root assumptions that govern the system itself.
That is, in part, because the energy industry, political lobbies, and many environmental campaigns, are ‘gaming’ overly-complex debates over technological specifications in lieu of a realistic debate over real, physical change.
Practically they do not argue about cutting emissions; they argue about which technology can cut emissions the most – even though, when you run the numbers, either option makes very little practical difference overall.
To cut through that pointless debate you need to understand the numbers that describe our present-day reality. That is what we will do here – as we would ordinarily do in our festival tour – in this edition of ‘WEIRD’. We’ll take the ‘official’ data, and other quality statistical sources, reworking them to show information which is rarely communicated within the energy and climate debate.
This is a complicated issue; people’s inability to understand the data allows politicians and eco-pundits to carry-on pointless debates – proposing ‘solutions’ that tinker with the energy system rather than changing it. We hope this ‘special edition’ exposes that.
‘Data shows the single most effective measure to reduce carbon emissions quickly is a global recession’
We start at the most controversial beginning; a truth locked within the data that mainstream campaign groups refuse to discuss.
Economics has sought to maximize economic activity to increase ‘wealth’ – an expectation we now reduce to the over-used term, ‘growth’.
Fossil fuels provide the energy and power that drive the world. Though technology makes things more efficient, in doing so it also boosts growth, consumption, and emissions. The ultimate expression of economic policy has, therefore, been an increase in energy consumption in-step with economic growth.
This is shown in the lower graph below, which plots the increase in the carbon emissions over 120 years.
The central idea of ‘green’ economics is to decouple growth from fossil-fuelled energy consumption. It is proposed to achieve this either through: Greater technological/organizational efficiency, to cut energy use; and, developing non-fossil fuel energy sources to displace fossil fuel use.
The problem for green economics is that recent research finds little evidence to show that a ‘green’ economy can decouple growth from carbon emissions. Instead we simply swap one type of ecological destruction – fossil fuel use – for another more nuanced form – such as burning trees for fuel or mining minerals for green technologies. That’s because there are not only limits to technological efficiency, but the production of ‘green’ technologies also results in ecological damage, which causes greenhouse gas emissions and damage to biodiversity.
For many trapped within consumer culture, this conclusion is dismissed as “negative”. It offers no hope of preserving the affluent modern lifestyle as part of solving climate change – which is why the popular political debate ignores this reality.
That admission, however, also exposes the lie – the reality that mainstream climate campaigns are inherently committed to preserving the affluent lifestyles of a small minority of the world’s population, rather than “saving the planet” for everyone.
The data for the graphs below is sourced from the Carbon Dioxide Information Analysis Center. They produce a global digest of carbon emissions, both from recent measured data, and from historic research into fossil fuel use dating from the beginning of the Industrial Revolution.
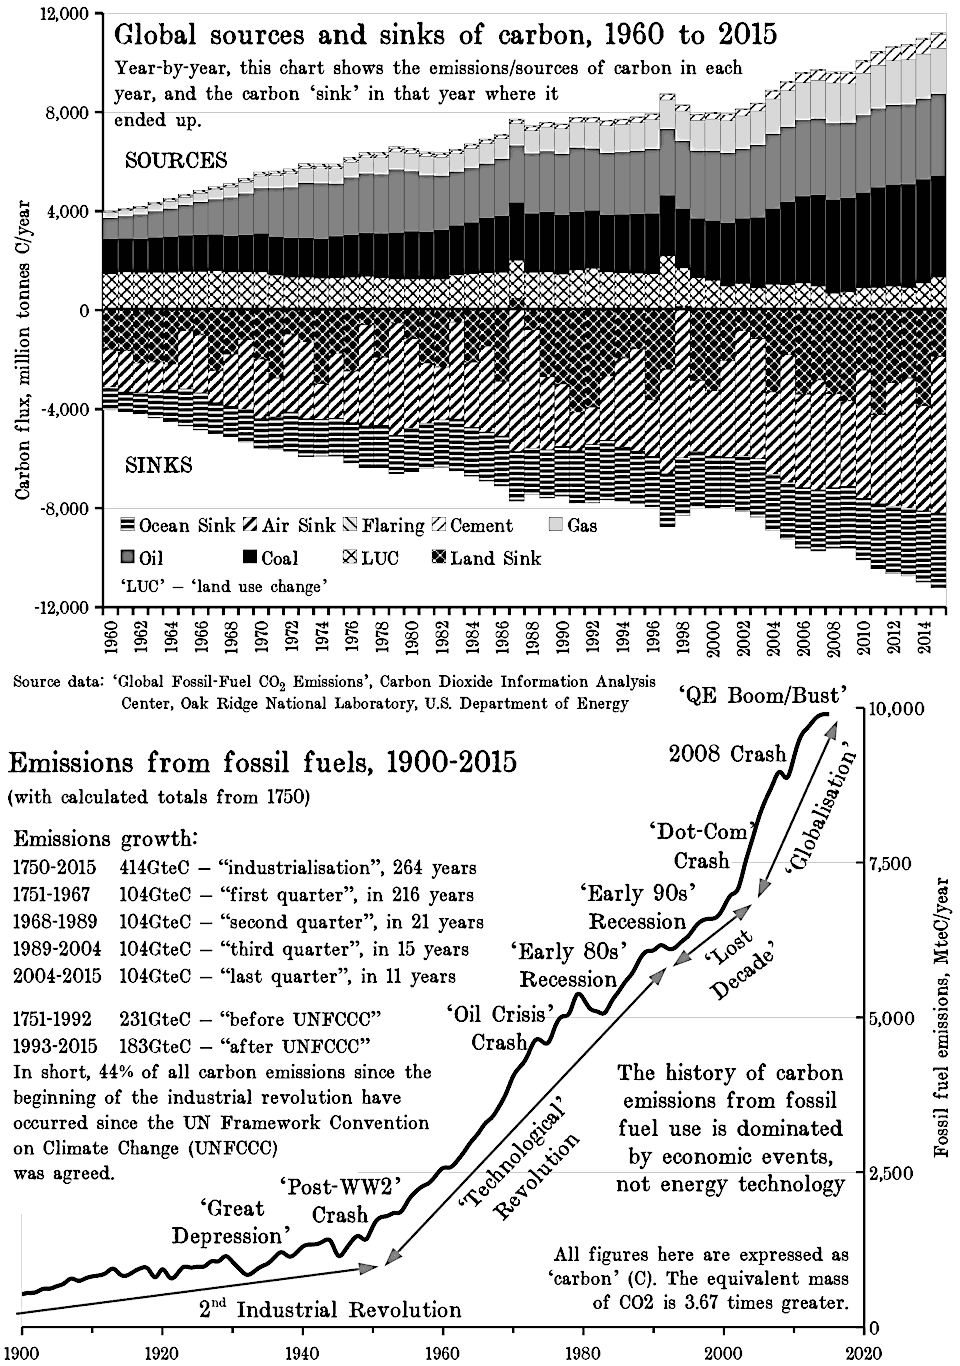
The top graph shows the ‘sources’ and ‘sinks’ of carbon emissions – where it comes from and where it ends up. What this includes in addition to fossil fuels is “land use change” (LUC) – activities such as farming and deforestation which emit carbon.
At present much of the carbon from fossil fuel use ends up in the atmosphere (‘Air Sink’), from which a good proportion transfers into the oceans (‘Ocean Sink’), and a lesser amount to plants and soils (‘Land Sink’). Look carefully and you will see the ‘Land Sink’ jumps around – and in two years, 1987 & 1998, it was briefly a source of carbon.
That’s because as the global weather patterns change, in certain years the amounts that the land sink can absorb vary and that dumps more carbon into the atmosphere. The difficulty in the future is that as forests burn, or ocean ecosystems die, the amounts that can be stored in the ‘ocean’ and ‘land’ sinks will decrease.
We’re also likely to see greater emissions from the land as Arctic permafrost melts – especially the more potent greenhouse gas methane. This will dump more carbon into the ‘Air Sink’, which is the most problematic because that’s the one which physically drives global warming.
The obvious solution is to cut emissions. This brings us to the lower graph which shows the total carbon emissions from fossil fuels use, flaring, and cement manufacture.
It’s not a straight line – in fact it has some large ‘teeth’. Those sudden decreases in emissions, as, well as the longer-term variations in the rates of emissions growth, are unrelated to the fossil fuels system. They are induced by economic factors related to economics crashes, or a rise in the price of energy which feeds through a year or so later as an economic contraction.
The ‘Technological Revolution’ after World War II drove economic growth, enabling new industries to develop, creating the ‘Consumer Society’ in the West. That in turn forced a steep increase in energy use as the expansion of mass consumption drove demand.
That was disrupted by the First Oil Crisis following the Arab-Israeli War – and initiated the economic changes which resulted in the collapse of Western industries in the early 1980s.
The economic shock as old industries died, and Western economies shifted more towards service industries, has been labelled ‘The Lost Decade’. What eventually turned that around was the world-wide boom created by the full force of ‘economic globalization’ – driven by the creation of the mass manufacturing economies in Asia, and the growing affluence of India, Brazil, and other middle income states.
The reality today is that we are locked into lifestyles which demand carbon-intensive systems of resource production, supply and manufacturing – all knitted together with fossil-fuelled transport links. Recent research shows that switching all that over to non-fossil fuelled energy sources in a decade or so, to meet climate change obligations, is impossible due to the resource implications. In part that’s because of the scale of annual emissions:
From the beginning of the Industrial Revolution in 1750 it took 216 years to emit the first quarter of the emissions shown in that data series; it has only took 11 years for the last quarter. Alternately, we’ve emitted a quarter of the carbon since the beginning of the Industrial Revolution in 1750 in the same time we have left to cut it to near zero.
Perhaps more pointedly, we’ve emitted 44% of the emissions, from the start Industrial Revolution to 2015, since the world decided this was a problem and agreed the UN Framework Convention on Climate Change (UNFCCC) in 1992.
“To speak of ‘limits to growth’ under a capitalistic market economy is as meaningless as to speak of limits of warfare under a warrior society. The moral pieties, that are voiced today by many well-meaning environmentalists, are as naive as the moral pieties of multinationals are manipulative. Capitalism can no more be ‘persuaded’ to limit growth than a human being can be ‘persuaded’ to stop breathing. Attempts to ‘green’ capitalism, to make it ‘ecological’, are doomed by the very nature of the system as a system of endless growth.”
Murray Bookchin, ‘Remaking Society’ (1990)
Since the 2008 Financial Crisis central banks have been giving ‘free money’ to banks – so called, ‘quantitative easing’ (QE). That has not driven real change. It has just supported asset prices, like corporate share values or house prices. Likewise there is no reason to suspect that any deal evolving from the Covid Crisis will lead to major changes in emissions either.
As discussed in Issue 2 of WEIRD, the most affluent 10% of the world’s population are responsible for half of emissions; the bottom half for only 10%. Therein lies both the cause and the solution to the crisis of climate change:

In 268 years of data, emissions only drop during economic recessions. We have to face reality. To reduce emissions quickly enough the global economy must shrink significantly. Very simply then, we have to engineer the contraction of an economic recession for the most affluent in the world without the social consequences this causes.
An Energy History of Britain
The history of energy in Britain is a catalogue of failure, from decisions that ignore ecological reality.
“Each year BEIS publishes updated energy projections (UEPs), analysing and projecting future energy use and greenhouse gas emissions in the UK.” Well, somehow they skipped 2020. Just the pandemic, or have they accepted this annual ceremony is absurdly pointless?
Lately the BEIS (Dept. For Business, Energy and Industrial Strategy) projections have repeatedly pushed a ‘business as usual’ agenda, based on large amounts of fossil fuels and nuclear power. Somehow they’ve allowed the debate over climate change, peak resources, and the need to reduce pollution pass them by.
Too often, when talking about how we will reduce carbon emissions, we pick a set of technologies and project “what would happen if…”. That ignores the history of how we got where we are today, why energy is used for a particular purpose, and that for the last two centuries energy supply in Britain has been a matter of circumstance not planning.
More importantly, it doesn’t consider the physical effects of building all that equipment, and the indirect effect of that process on the Earth.
The graph below uses historic data to show the ‘history’ of UK primary energy use; ‘primary energy’ being the input raw fuels, or directly producing biomass/solar/wind/tidal sources, before we refine them or use them to generate power.
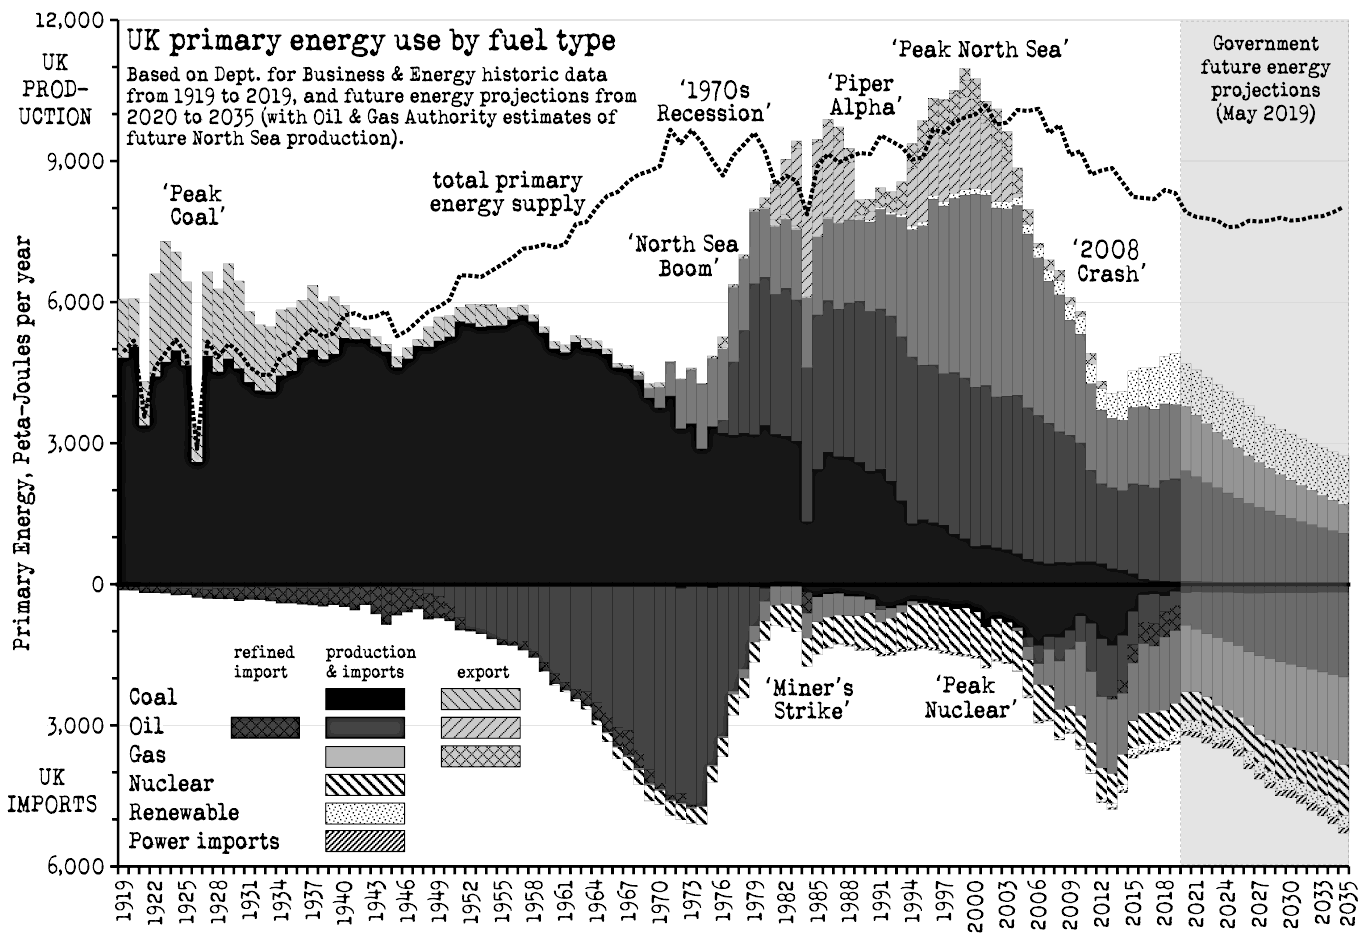
That in itself is a bit misleading. About a quarter of primary energy (including renewable biomass) is currently ‘lost’ as heat during the power generation or supply process. Yes, we could seriously reduce that loss of energy, but doing so would involve completely redesigning how the UK energy industry works – and that is not on any political agenda (not even the Greens, who are still wedded to national grids).
There’s something at play here that most people commenting on the energy debate refuse to engage with: Ideology.
It’s not simply that when discussing power generation people argue about private versus public – i.e., neoliberalism versus corporatism. The true ideology at work here is one of consumerism – the idea that we can just keep consuming without end, even when the available evidence indicates that the energy or resources we need to do that will not be available in the future (physically, or they’ll be too costly).
And the much-hyped hydrogen economy? Hydrogen is not a source of energy; it is a carrier, like electricity. It requires a source of energy – coal, oil, gas, or nuclear – to create it. Hydrogen isn’t included in these projections because it’s not a ‘primary’ energy source. In any case, hydrogen is pretty-much a distraction created by the oil and gas industry as an argument to keep producing – making hydrogen and capturing the carbon to store it underground.
The ‘0’ line on the graph above is important: Everything above the line was produced within Britain; everything below the line was imported. The dotted line at the top is the ‘total primary energy supply’ (TPES) – how much energy the country uses.
When the columns pass the TPES line, which has only happened briefly over the last century, Britain was a net energy exporter; we produced more than we used.
Up until the First World War Britain was the ‘Saudi Arabia of coal’, exporting it all over the empire. Then around 1920-24 we hit ‘Peak Coal’, after which it became physically impossible to dig more as mines slowly ran out of economically viable reserves to produce.
That wasn’t a problem. Just at that moment combustion engines arrived to take over industrial tasks more efficiently. Of course we had no oil of our own then so it had to be imported. The explosion of demand for oil up to and beyond World War Two can be seen as the increasing amount of oil imported into Britain.
Why did Britain fund the coup, carried out by the CIA, which deposed the last democratically elected secular leader of Iran in 1953? – as shown in the recent documentary, ‘Coup ‘53’. See the graph!

Most of that oil being imported came via the Anglo-Iranian Oil Company; what would be renamed British Petroleum the year after the coup. The thought of losing control of that oil was too much for a country that, pre-Suez, still had imperial ambitions. The staging of the coup would also encourage the US to try similar ‘regime change’ operations around the world – most recently in Bolivia, to get for lithium for electric cars.
From 1946 to 1973 energy consumption in Britain rose consistently fuelled by oil, even as coal declined. This was what created the post-war consumer boom.
That came to an end with the ‘1973 Oil Crisis’, sparked by the Arab-Israeli War. The supply crunch sent the average annual oil price from $1.80 per barrel in 1970 to $36.83 in 1980 – after the fall of the Iranian regime set-up by the US & Britain.
With oil prices rising so fast, in an economy built on cheap oil, everything tanked. The collapse of the post-war political consensus, and the rise of neoliberalism with Thatcher & Reagan from 1979, was initiated by this trend.
What ultimately saved the British economy, but more significantly what enabled Margaret Thatcher to afford to close heavy industries and mines and make millions unemployed, was North Sea oil. It freed Britain from imports, created foreign income from exports, while all the time creating jobs here in related industries.
North Sea production fell briefly after the Piper Alpha disaster in 1988. But, like all resources, mining reaches a peak and then falls away: ‘Peak Oil’ for the British sector of the North Sea took place in 1998; ‘Peak Gas’ in 2000. Nothing can be done to stop this long-term trend.
The Oil & Gas Authority (OGA) project future oil and gas production. The figures used here after 2019 take the OGA’s figures without comment – except to say that they are hopelessly optimistic! They assume production declining until 2050, when it fact it might not pass 2030 or 2035 – because lower economic returns make the operation of the whole system less viable.
While other countries, like Norway, ploughed their earning into sovereign wealth funds for the day when the boom ended, Britain spent it on low taxes for the wealthy and unemployment & low income benefits for the poor; we blew it!
Britain was the first civil nuclear power generator, in 1956. Nuclear power in Britain peaked in 1994. Britain’s first PWR reactor, Sizewell-B, opened the following year, but that could not make up for the retirement of the old Magnox power stations built during the 1960s. The generation after that, the AGR reactors, are closing down right now.
Britain’s new EPR reactor, Hinkley-C, started construction in 2018. If it runs like EDF’s other projects in France and Finland it may not open to 2030. The plants in Anglesey and Cumbria have failed, and another at Sizewell now looks very unlikely to proceed.
In any case, as the graph shows, all the uranium for these reactors is imported. We have no viable uranium resource of our own. Britain is weighed down with depleted uranium from 70 years of nuclear fuel manufacturing but it’s useless in these reactors. To use that we need the one thing science has been unable to develop – a stable and commercially viable ‘fast reactor’. All-in-all then, nuclear has no future here.
In the meantime we import nuclear electricity from Europe, via high voltage inter-connectors – shown as ‘power imports’ on the graph.
We’ll look at the details of renewable energy in an article later; that needs a lot of space to explain!
Next, gas. Up until the 1970s ‘town gas’ was made from coal. Then we imported liquefied gas from Algeria briefly before North Sea gas arrived. Now North Sea gas has come & gone: We became a net importer in 2004; in 2020 we’ll likely import half our gas needs; and production may cease by 2035. Curious then that in 2020 the government approved a new 1.24GW gas-fired power station, at Immingham in Lincolnshire.
According to the OGAs future projections we will continue burning gas. Even though the Climate Change Committee has said there should be no new domestic gas boilers sold after 2025, the OGA’s projections still show gas being burned in an increasing amount in domestic premises.
There are only three possible sources for this new gas:
- Firstly, continued supply by pipeline from Norway, where most of our imports come from today (but Norway will peak production in the next decade or so);
- Secondly, the gas pipelines that traverse Europe from Russian gas fields as far away as Siberia (which represent a bit of a geopolitical nightmare);
- Thirdly, importing liquefied natural gas (LNG) by ship from North Africa, the Middle East, and, potentially, as far away as Australia (which is a different but no less fraught geopolitical chain).
We could spend a lot of time arguing over those, but let’s state the bleedin’ obvious here; we can’t do it.
If Britain is to meet its climate change targets then we have to significantly cut gas consumption this decade, not increase it as the OGA future projections indicate.
All these projections assume – like the industrial economies of the world generally – that ‘carbon capture and storage’ (CCS) will be available this decade to solve that problem. There is currently no reason to believe that it will be available at sufficient scale to do that, in part because the economics of CCS make energy significantly more expensive.
Of course the other great hope for CCS is coal powered plants – but not only are the economics difficult, we’ve largely exhausted the viable coal deposits here.
“And finally”, the future of oil? We’ve recently passed global ‘Peak Oil’, and we’re likely to see a spike in global oil prices once we escape the ‘Covid recession’. Fracking has collapsed in a swamp of debt in the USA, which was all that kept high prices at bay. Depletion of other regional oil fields means that from now on there will be less oil available (climate policies or not).
Currently the decarbonization plans for oil are mainly based around electric cars and lorries. Again, as we covered in WEIRD No.2, recent scientific reports have cast doubt on that being a viable option; the amounts of metal resources required make it incredibly difficult to do. In any case, the Government’s projections are not assuming an increase in power generation sufficient to quickly switch to electric transport by 2030 or 2035.
To conclude, what can we learn?:
In the early 1950s Britain’s dependence upon oil made it throw Iran into chaos – and in the end that dependence cost us the economic crises of the 1970s, in part initiated by that same foreign policy.
The North Sea arrived, and we blew it on ideological economic battles.
Problem is, we’re still locked in those same ideological battles of the 1980s – and in that battle our energy history is irrelevant because people don’t want to accept the most import fact: Everything that has a beginning has an end. Even the environmental movement has a problem in that respect – which is arguably why it can’t make progress.
Home Energy Use – ‘Domesticity’ breeds confusion
The media focus on domestic energy; it doesn’t amount to much, and so distracts from other parts of the economy.
A picture can say a thousand words – which is why we’ produced the flow chart below. This shows, at scale, the movement of energy through the UK economy in 2019 – as mapped out by the Government’s annual statistics.
In the diagram, energy produced in Britain enters on the left and is consumed on the right; energy imports come in from the top, and exports and losses leave at the bottom (‘bunkers’ are the fuel loaded onto ships). It also shows the ‘primary’ and ‘final consumption’ boundaries that were talked about earlier:
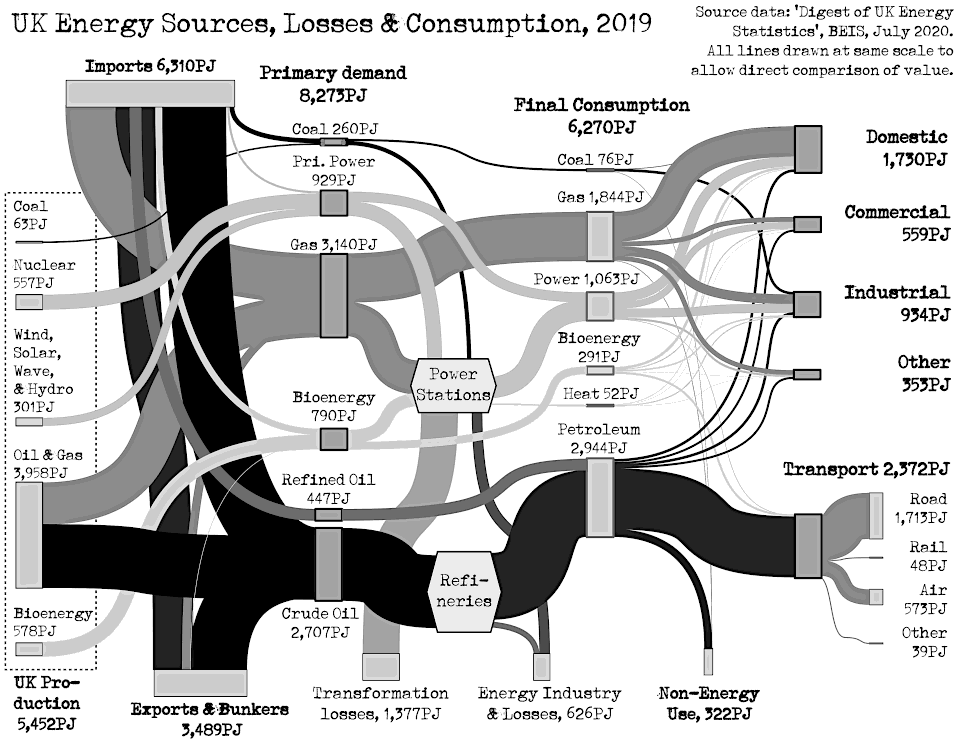
Note the large ribbons that connect ‘imports’ to ‘exports’. Britain is part of a system of global energy trading, the result of our North Sea production. That has a big drag on the speed at which policy can change in Britain – because we're still trapped in that mindset of mass consumption from dense fossil energy sources.
Britain produced about 5,450 peta-Joules (PJ) of energy in 2019; about two-thirds of the primary energy the economy used. The rest is met by imported fossil fuels.
That production figure is now dropping quickly though, and the Oil & Gas Authority project that by 2035 oil and gas we production will drop from 45% of primary supply to around 20%. That’s begs the question as to whether we can remain part of that energy trading network, and the consequence that has in terms of energy prices and availability if /when we cannot.
Primary supply is 8,270PJ; final consumption is 6,270PJ. What happens between is that fuels are converted to electricity and crude oil is refined into liquid fuels. Where does the missing energy go?
It heats the countryside: The losses from our supply system (2,000PJ) are more than the heat and power used in domestic properties in Britain (1,730PJ). Strange how that issue is so poorly explored by the media in their coverage of energy issues.
There are 27.8 million households in Britain, consuming 1,730PJ – an average of 62 giga-Joules per household (GJ, a millionth of a peta-Joule) per year. That’s a lot more than metered consumption due to the use of un-metered sources, and because businesses and other uses are sometimes logged as ‘domestic’ consumption.
In 2019, the domestic sector consumed 28% and transport consumed 38% of ‘final’ energy consumption. That’s not the same across all fuels though. While transport used 77% of the petroleum and 1.8% of the electricity, houses used 60% of the gas, 35% of the electricity, and 25% of the coal, but only 3.6% of the petroleum.
This is another reason why looking at everything in relation to household energy consumption is wrong – it ignores the specific reasons why energy is consumed. If energy is limited in the future that means something totally different in the transport sector as it does in homes and buildings. Measuring everything in terms of houses misses that complexity.
Let’s assume a house uses 62GJ of energy/year, around 0.007GJ/hour – or two kilo-Watt-hours (kW-h).
A Formula One race lasts around an hour-and-a-half. During that time a single car will use a maximum of 110 kilos of high-octane fuel, with an energy value of 4.9GJ. That’s around 3.26GJ/hour, or 905kW-h – the hourly average for 450 households.
The fact you don’t get a lot of F1 cars per town shows the stupidity of using household consumption to measure national progress.
Why do the media often relate issues to household consumption, or energy targets? The fact is they are valueless. For example, whose house are we talking about here?
OFGEM, who regulate energy markets, each year publish ‘Typical Domestic Consumption Values’ (TDCVs) – three bands with which they class domestic electricity and gas users. The highest band is two-and-a-quarter times more than the lowest one.
A study in the journal ‘Global Sustainability’ in July 2020 found that across Europe, the most wealthy 10% of households had a combined carbon footprint equivalent to the lowest 50% of households. A similar study of US households, published the same month in ‘PNAS’, found that in the same town the footprint of the most wealthy households could be 15 times larger than the poorest ones.
There’s are also global inequalities in energy use. According to the World Energy Forum, homes in Europe use 3,600kWh of electricity per year, while those in China average 1,500kWh, India 1,100kWh, and electrified homes is Nepal just 320kWh/year.
As we'll examine later in article 6, industrial energy use in Britain has collapsed over the last few years. As primary manufacturing industries have closed our energy use has fallen, but we still consume that energy ‘embodied’ in the finished raw materials or goods we import.

What that means is our progress towards meeting climate change targets got better because industrial consumption fell. At the same time though we imported those goods from someone else’s economy, meaning we have a similar impacts globally even though our emissions targets say ‘we got better’. Is that considered in the way the media cover our energy situation? Absolutely not.
Renewable energy – An ‘uncontested good’
Everyone loves renewable energy, don’t they?; but few really understand its relative scale of its contribution to energy supply, and certainly not the sometimes gruesome details of its production.
In this section we explain the ‘hard’ data on renewable energy in Britain. That raises issues about how we hold this debate: That across large sections of society, renewable energy and its place in our future is treated as an ‘uncontested good’.
An ‘uncontested good’ is a topic the public decide, informally, is not open to critical debate. “It” (whatever ‘it’ is) activates our brain’s confirmation bias, making people irrationally defend something against the available evidence, instead of confronting the more unsettling reality of the problem in front of them.
At the very least this bias masks age-old issues like gender or race inequality; at worst it can lead to censorship or attacks on people who try to hold such taboo discussions. In short, though humans can be stupid on their own, in reality humans can be far more stupid when they uncritically ‘think’ together, and stop others raising criticisms in response.
When it comes to renewable energy, the reluctance to discuss its down-side is tied to a deep attachment to economic ideology more than to the issue of solving climate change. Renewable energy offers a simple solution that doesn’t require difficult economic or social changes; and yet the way renewable energy seeks to preserve the current economic order also creates barriers to tackling climate change quickly.
The Free Range Network have been trying to explain this for over 20 years – only to receive some quite nasty responses in the process.
The graph below shows Britain’s ‘renewable’ energy production, from 1998 to 2019, as defined within the Government’s energy statistics. What complicates the figures is that some renewable sources are used for heat (H), some for power production (P), and some for both – and how they are then counted in the figures is not consistent.
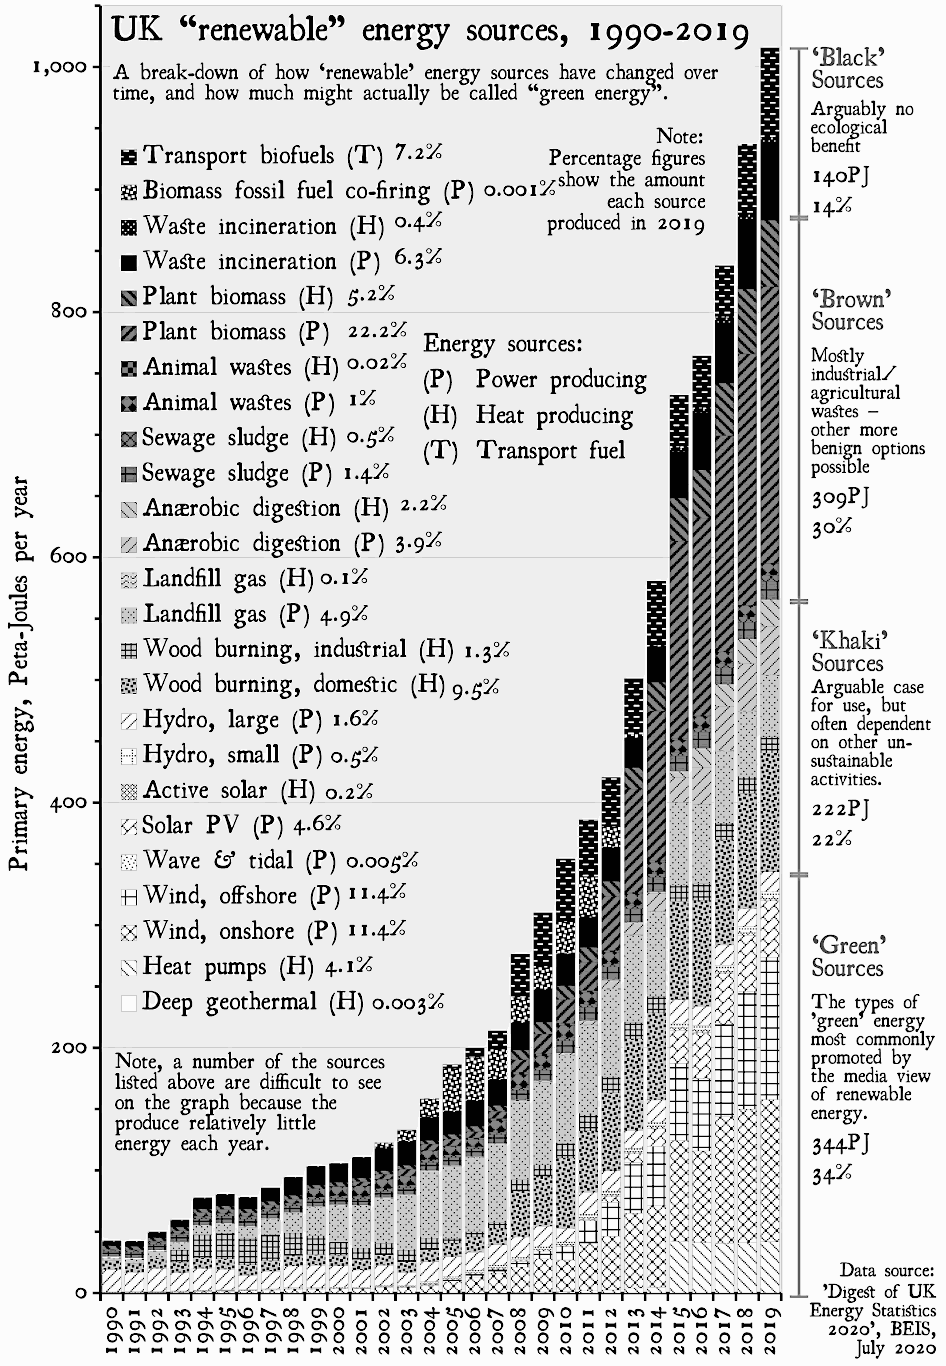
This is the first and often most difficult fact to get the public to understand; what the Government call ‘renewable’, and what they might give a public subsidy to, need not be ‘renewable’ – and might even cause serious ecological damage as a result of its use.
When the electricity industry was privatized in 1989, the Government introduced the ‘Non-Fossil Fuel Obligation’ (NFFO) to prop-up the nuclear industry. Problem was, they couldn’t discriminate against non-nuclear non-fossil energy so had to give renewable sources a subsidy too – but nuclear still got 95% of the money back then.
The ‘Renewables Obligation’ (RO), introduced in 2002, is not much better. That’s because all of these systems are based on maximizing power production, across broad categories of technology, without any specific assessment of their environmental performance – and certainly not incentivizing reductions in power use or increasing the system-wide efficiency of energy production. That has meant the technologies used to create renewable energy have mostly focussed on being ‘big’, and being structured to capture subsidies rather than demonstrably help the environment.
For example, what do you think renewable energy is? Wind turbines? Solar photovoltaic (PV) panels?
What about waste animal carcasses from slaughterhouses, rendered down and transesterified to create ‘green’ fuel for vehicles? (vegans don’t like talking about that when driving biofuelled cars).
Or what about all the ‘solids’ from your local sewage works – the lumps in the poo, plastic particles and hair – burned to make heat or power?
That’s the bigger issue about Britain’s ‘renewable’ energy policies. They are an adjunct to the waste industry, enabling waste to be economically processed while creating a token amount of heat or power. In the process that not only limits their effectiveness as climate solutions; it also preserves and subsidizes the often damaging and wasteful forms of industrial or domestic consumption which generate those wastes.
Why a token amount of energy?
Often – for example, burning household waste – the energy returned is only a fraction of what could have been saved had the waste in question been recycled, or not produced in the first place through better manufacturing processes/less consumerism.
The graph groups different renewable energy sources together to represent how “green” these energy sources really are:
- The ‘green sources’ – which represent the popular view of renewable energy – contributed 34% of primary renewable sources in 2019, which translates to 4.3% of the primary energy supply (PES) in 2019;
- The ‘khaki’ sources – not ‘green’ because they rely on other damaging activities to make them function – contributed 22% of renewables or 2.8% of PES in 2019;
- The ‘brown’ sources – involving waste materials, and human or animal excreta – contributed 30% of renewables and 3.9% of PES in 2019;
- Finally, the ‘black’ sources – operations for which there is no objective environmental benefit – contributed 14% of renewable energy and 1.8% of PES in 2019.
Practically the data is difficult to interpret, to put each source in one group or another – e.g. see the discussion about wood pellets below. Even the same technologies can have very different impacts on different sites.
Many people experience a problem with this data when they see it. That’s because it contradicts popular media headlines such as:
“‘Substantial increase’ in wind and solar power helped to generate 47% of Britain’s electricity”.
The difference between what the headlines say, and what the data says, is due to the statistical ‘fix’ that is used to represent renewable energy targets, and the role of electricity in that target. Let us explain:
‘Power’ is not equivalent to ‘energy’ or ‘fuels’ in the economy. Power has to be generated in power stations which lose somewhere between a half (gas-fired), to two-thirds (coal or biomass-fired), to three-quarters (waste incinerators) of that energy to the environment as waste heat. Some countries use that heat to improve efficiency, but in Britain ‘combined heat and power’ (CHP) is usually only found in large industrial or commercial plants – not shared across communities where ‘waste’ heat can be put to other uses.
‘Primary’ energy is a measure of a the raw fuel which enters the economy, before it reaches power stations, refineries, and consumers.
The ‘Secondary’ or ‘Final Consumption’ measure is the amount of energy actually consumed by people and businesses in the country – and is around 25% less than the ‘primary’ energy supply.
Government targets for renewable energy are based upon the smaller, ‘final’ figures – meaning that there is a smaller target to meet. As electricity is generated from primary fuels, it is part of the ‘final’ energy figure. Instantly then renewable energy targets exclude that missing 25% – energy that could be potentially available for use if we overhauled our large, concentrated system of grid-connected generators by introducing smaller, more local grids.
Another problem is that, because of the history of how Government has subsidized renewable sources, there is a bias is towards energy sources that generate electricity for the grid, and of a large enough scale to be traded in the commercial energy market. That bias towards grid connection prevents radical changes in policy taking place. Grid connection – and the highly energized 24/7/365 consumer culture it is designed to support – is biased towards perpetuating current high consumption levels rather than rewarding people for consuming less.
In 2019, in terms of all the energy consumed by industry, commercial sites, and homes, only 17% – less than a fifth! – was in the form of electricity. That means when the headlines say, “wind and solar power helped to generate 47% of Britain’s electricity”, what they mean is:
- 47% of electricity was ‘renewable’ – although only two-fifths of that was wind and solar, the rest being a mixture of electricity generated from highly doubtful sources such as landfill gas or waste incineration;
- Electricity is 17% of ‘final consumption’, so 47% of 17% is 8% – which means less than one-twelth of all energy consumed was ‘renewable’, and only 3% of energy consumption was in sourced from wind or solar;
- And of course, as ‘final’ consumption is 75% of ‘primary’ energy supply, it means only 6% of all the energy consumed by the economy was ‘renewable’, and only 2⅓% was wind and solar.
Let’s make something clear:
Wind and solar will without a doubt be an important part of our future energy supply. That is NOT the issue here.
Renewable energy, low density and localized, is expected to fit in a system of high consumption from grid-connected dense energy sources. It will never do that efficiently.
The government will never commit to a form of policy which truly supports renewable energy; that would inevitably undermine the systems of mass consumption today’s energy policy is there to enable. Technical issues aside, that is why renewable energy cannot reduce carbon emissions significantly in Britain.
The scandal of the ‘green’ biofuels that damage the Earth
Calling it ‘renewable’ doesn’t make energy sources ‘ecologically’ sound.
This graph shows the use of ‘renewable’ plant biomass and liquid biofuels from 2005 to 2019. The imports are the hatched blocks dropping below the ‘0’ line.
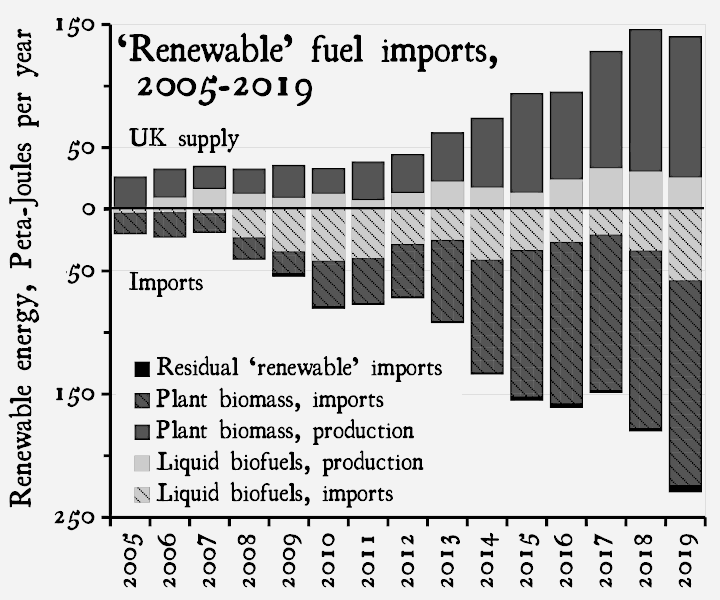
Since 2008, over 97% of ALL renewable energy imports were just two fuels:
- Liquid biofuels – which may be biodiesel or bioethanol, to be blended with fossil fuels to reduce emissions from road vehicles; and
- Plant biomass – which is essentially ground-up or chipped trees, often formed into wood pellets, which are burned to produce heat and/or power.
Note the levels of imports surged after 2011 due to the introduction of the ‘Renewable Heat Incentive’ (RHI), which subsidizes the costs of wood fuel for space heating in large, automated boilers (traditional types of locally produced ‘lump wood’ fuel don’t get a subsidy).
The ‘residual’ imports of other renewable fuels are shown as the (barely visible) blocks at the bottom of each column.
Today the growing of biofuel crops on land – often in large monocultures in areas that were formerly rainforest or had high biodiversity – is being flagged as having little benefit for the climate. Likewise the cutting of forests to make wood pellets, on the basis of recent research, has at best a negligible benefit for the climate, and at worst is accelerating climate change.
In any one year two-thirds of the demand for these fuels is made up from imported materials. What this means is that farmland or forests from many countries around the world are being used to fuel our economy – and public money is subsiding that.
In terms of scale, the greatest harm today is being caused across the large areas of temperate forest in the USA, Canada, as well as Eastern Europe and Romania – cleared to make the wood pellets.
“A Man came into a Wood one day with an axe in his hand, and begged all the Trees to give him a small branch which he wanted for a particular purpose. The Trees were good-natured and gave him one of their branches. What did the Man do but fix it into the axe head, and soon set to work cutting down tree after tree. Then the Trees saw how foolish they had been in giving their enemy the means of destroying themselves.”
Fables of Aesop
The EU’s Renewable Energy Directive required 20% of all energy usage in the EU, including at least 10% of all energy in road transport fuels, be produced from renewable sources by 2020. The Fuel Quality Directive required the road transport fuel mix in the EU to be 6% less carbon intensive by 2020. This is what is driving the boom in biofuels and wood pellets.
As yet, not just in the UK but at the EU level, there is a resistance to looking at the evidence on the impact these policies. Given such a large proportion of national targets are currently supported by schemes burning wood and biofuel, stopping this practice would create a major dent in the progress towards the EU’s climate targets.
There is a cynical trade-off at work here: Politicians in the affluent West are deliberately running schemes which cause demonstrable harm to the environment, and which probably make climate change worse.
If they were to halt these schemes, the only practical alternative to meet emissons targets would be more controversial changes to economic and social policy – which is considered politically unacceptable. That’s because tackling space heating or driving cars without serious lifestyle change is difficult.
Has ‘Green’ gone wrong? – Shifting the debate on energy & climate change
The film ‘Planet of the Humans’ caused a storm in green circles. What they failed to realize was the character of their response actually accentuated the film’s arguments.
(A re-working of the blog posts by ‘Ramblinactivist’ Paul Mobbs: ‘Planet of the Humans’, published 1st May 2020; & ‘Cooking scones with The Prodigy’, published 18th May 2020)
A new Michael Moore film… what’s not to like? Well, according to the reviews there’s an awful lot not to like in this film. It has many people very excited, though perhaps not in the most rational of ways.
If the Free Range Network is a little more ‘radical’ than most (in terms of the original meaning of that word, of ‘going to the essential or original’) then it’s because we’ve been here a long time. Activists in the Network remember the ecology movement of the 1970s and 1980s – before the movement was bent towards the consumerist mindset of ‘green’ over the 1990s.
In part the creation of the Network, during 1994 and 1995, was to try in fill in the gaps opening up in the movement back then; as certain ‘controversial’ issues were dropped by mainstream campaign groups.
A decade ago Heather Rogers published, ‘Green Gone Wrong’, looking at how shaping ‘green’ ideas to fit capitalism had debased its ecological values. More recently reports by various groups exposed how security guards ‘protecting’ species for trans-national organizations like WWF had killed or tortured indigenous people in Africa.
The film ‘Planet of the Humans’ is part of that same pattern; exposing how the movement ceased to be about protecting the planet, and instead seeks to preserve Western affluent lifestyles with ‘green’ technology.
The response to the film by those groups in fact accentuated the arguments it.
Many complaints had no specific reference to its content. For example, while filming a solar PV array at Earth Day in 2015, some passer by said it would only, “run a toaster”. The array looked to be about 13 kilowatts (kW) – ten times more than a toaster. Thing is, when the guy running the PV array was interviewed, he pointed out the concert was being run not from the PV array at all, but a diesel generator; which, given its size, was rated at something like 50kW to 100kW – four to eight times more than the PV array.
The critics focussed on the toaster, while ignoring the big black diesel generator supplied by one of the event’s sponsors, Caterpillar – one of the largest manufactuers of heavy-duty construction equipment in the world.
Critics also claimed that the film was supported by climate change sceptics. For example, ‘ecomodernist’ Michael Shellenberger, who wrote a review in Forbes. But you can see how fickle Shellenberger’s grasp of reality is when he writes:
“…humankind has never been at risk of running out of energy. There has always been enough fossil fuels to power human civilization for hundreds and perhaps thousands of years, and nuclear energy is effectively infinite.”
Let’s be clear, Michael Shellenberger doesn’t like the film. His Forbes piece is poking fun at it. What Shellenberger likes is that the film makes environmentalists painfully unhappy. Practically he suffers from the same flawed, perhaps willingly ignorant beliefs as many of the people he criticizes – like the idea that energy can keep flowing forever.
One of the greatest agitators after the film’s release was ‘Gasland’ director Josh Fox. Much of what he said in a long letter about the film had nothing to do with the content of the film at all, just Fox’s take on what he believed it said. Even his specific points – e.g. PV panels shown in he film were “out of date” – later turned out not to be valid.
One of the strangest replies came from climate campaigner Bill McKibben – who features heavily in the film.
His response?:
“As for taking corporate money, I’ve actually never taken a penny in pay from 350.org, or from any other environmental group.”
McKibben has called for environmentalists to cooperate with the Pentagon – one of the largest single carbon polluters in the world, and the greatest exporter of human rights abuse. He has also been fronting campaigns for business groups and billionaires, promoting techno-fixes to climate change.
One of the techno-fixes the film really picks part is burning biomass – and McKibben’s role in promoting that. Following the release of the film McKibben stated he had ceased to support biomass in 2016. According to an investigation by journalist Max Blumenthal in the on-line magazine, ‘GreyZone’, that is questionable. Less than a week after the campaign to ban the film started, McKibben took part in an event that was sponsored by a green investment fund with large investments in biomass companies.
Eventually the campaign against the film flowed across the ocean to reach Britain – in the guise of a Guardian article by George Monbiot.
Monbiot attacked various aspects of the film, from PV technology to the role of gas replacing coal burning. What’s really interesting about Monbiot’s analysis though is that it is demonstrably false – to an extent which leads us to ask whether he willingly misled his readers in order to destroy the film-maker’s work.
For example, criticizing the attack on how much energy PV panels produce, Monbiot says: “On average, a solar panel generates 26 units of solar energy for every unit of fossil energy required to build and install it”.
He quotes that from a research paper; sounds fair? Until you read the paper. It states the paper should not be used as a comparison with present-day technology because the assumptions of their model under-estimate present-day impacts by 30% to 250%.
Did Monbiot not read the paper – or did he read it and use it anyway?
Monbiot then goes on to attack the point that as coal-fired power stations in the US were closing, they were being replaced primarily with new gas-fired plants rather than renewables. He says:
“Planet of the Humans also claims that you can’t reduce fossil fuel use through renewable energy: coal is instead being replaced by gas”
The graph, below-left, shows data from the US Energy Information Agency for power generation. Federal energy data is problematic as it’s largely left to states to collect. Even so, what the data shows is… gas-fired power generation is increasing at a rate of 2:1 compared to renewable sources as old coal- and oil-fired power plants close.
Monbiot then goes on to say:
“As a result of the switch to renewables in this country, the amount of fossil fuel used for power generation has halved since 2010”.
The graph below-right show BEIS data on the fuels used for power generation (a more accurate view than the US data because that takes account of the efficiency of the plant too, not just how much power they generate). Within the UK economy there is a factor at play that does not appear in the US data – austerity.
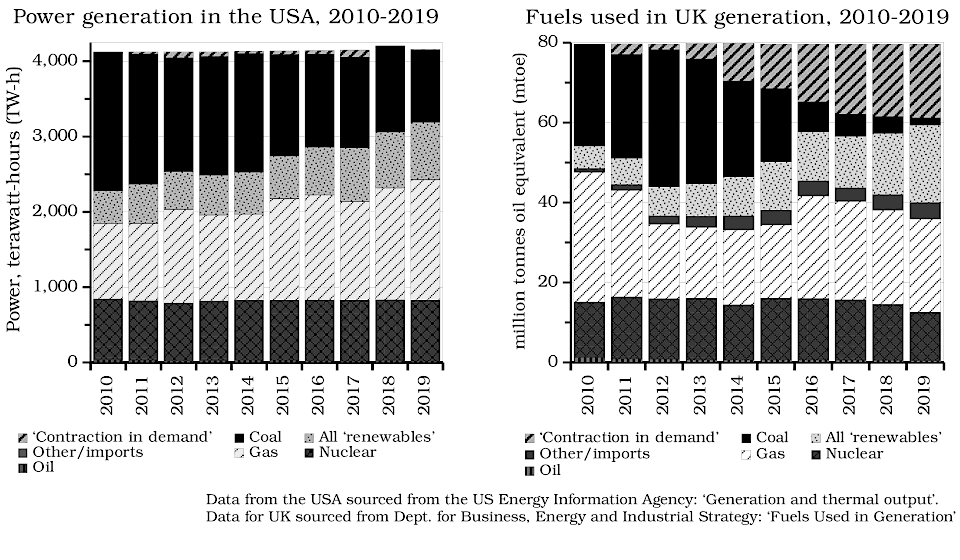
In Britain coal-fired plants have closed due to an EU directive. EU directives have also (minimally) influenced the efficiency of new homes and consumer goods too. But for the last decade the greater factor has been economic austerity, and its effect in depressing both demand and economic growth – leading to a fall in energy consumption.
Do the sums, and for every unit of new renewable energy in the UK one-and-a-third units of ‘demand destruction’ were added to the mix.
This is not the first time Monbiot has manipulated reality; he has done similar things before – such as when he tried to defend nuclear power after the Fukushima disaster in 2011. The question is, is he just deliberately misleading his readers for his own ends, or is he merely doing this because he feels that it is what is expected of someone in his position?
“Incremental change is the name of the game, not transformation. And that, of course, means that the emerging solutions have to be made to work within the embrace of capitalism. Like it or not, capitalism is now the only economic game in town.
For fear, perhaps, of arriving at a different conclusion, there is an unspoken (and largely untested) assumption that there need be no fundamental contradiction between sustainable development and capitalism.”
Jonathon Porritt, ‘Capitalism as if the World Mattered’ (2005) – my emphasis in colour
In 2005, one of the major figures in the UK environment movement, Jonathon Porritt, published a book, ‘Capitalism as if the World Mattered’. As shown in the quote to the right, while having no proof, he proceeds as if capitalism could be made ‘sustainable’ – and spent a number of years thereafter polishing the reputations of neoliberal governments and their business associates in order to greenwash their ineffectual eco-policies.
Is George Monbiot’s “accentuation of the positive” so bad?
We tried to raise this issue with George Monbiot via social media, but he never replied. Not to be put-off, some of the Free Range Network produced a detailed complaint to the ‘Reader’s Editor’ of the Guardian. The complaint was never answered.
It’s almost as if the leaders of the green movement are behaving like an unaccountable elite?; in many ways, just like the elite networks of fossil fuels producers or bankers they blame for climate change.
The fact is the mainstream green movement, thirty years ago, voluntarily walked into the halls of power – and they have been part of that establishment since then.
Let’s think of this another way: In the 1960s and 1970s various activists movements arose in the West. For example, feminism, civil rights, LGBT rights, and of course, environmentalism. How have they all fared in the years since? When it comes to all of those causes – with the exception of environmentalism – though there are still a lot of changes that need to be secured, the position of race, gender, sexual, and political rights is better than it was sixty years ago.
As recent reports on the global environment show, from climate change, to pollution, to biodiversity, the result is the opposite – the world is far worse today than sixty years ago.
Thirty years ago what had been the ‘ecology movement’ in Europe and the USA took a decision to change course – to engage with mainstream politics and business. It was led by figures like Jonathon Porritt who, as shown above, were willing to compromise on the objective details in order to trade-up their access to decision-makers.
This strategy has demonstrably not worked.

Bill McKibben and George Monbiot are the inheritors of that decision today. When Bill McKibben says we need to work with The Pentagon, its coming from that same place – a belief that to succeed you must bow to the strictures of the political and economic establishment. Today, from recent research on the workings of the human system, we see that the core values of that establishment are not only unsupported by rational evidence, they are literally ‘toxic’ to the maintenance of life.
The ‘green’ movement needs to have a hard think as to where their future direction lies – lest they simply just lie to justify their current failure, and attack those who remind them of those failures. As with industrial society in general, unless the movement changes course, continued failure is certain.
Energy follows lifestyle – Where does it all go?
What the national energy statistics do not fully capture is lifestyle – and how lifestyle influences emissions. Common sense says we must create our own ‘lifeboat’ options instead.
It’s not rocket science: To halt the warming climate we cut emissions; and if we listen to green campaigners and the media, all we have to do is switch to green energy and electric transport. In reality that view is so far from what the evidence shows it deserves to be ridiculed for its overly simplistic naivete.
The fact is, the way energy use and carbon emissions statistics are collected is: At best, a rough estimate; and at worst, gives a completely erroneous view compared to actual reality.
Take the emissions from natural gas. World energy and climate change agencies use figures sourced from the International Energy Agency (IEA). IEA figures assume the emissions from natural gas production to be a certain amount, and those amounts are based upon figures created by industry sources from what’s called ‘inventory analysis’.
If there’s one positive thing to have come out of gas fracking it’s that environmental science has trashed the data produced by inventory analysis. Sampling of the real world has shown repeatedly that inventory analysis produces large under-estimates of leakage, meaning that the actual emissions from natural gas production are worse than stated. For now though, governments stick with inventory analysis; in part, because it allows gas to remain a “bridge fuel” for industry, avoiding more radical changes.
At the other end of this equation – climate change – there are also problems related to ‘conservative’ science.
The observed evidence of climate change on the ground, from collapsing glaciers to warming oceans, is worse than the scientific models predict. Though many talk about the Paris Agreement as the mechanism to ‘save the planet’, the science behind it was arguably out of date when the agreement was signed. Despite this, groups such as Extinction Rebellion want a new law requiring compliance with the Paris Agreement targets, even though it is demonstrably inadequate.
This is the reality of energy and climate change statistics; one which those in campaign groups who quote them would be wise to take note of: These statistics are only as good as the assumptions upon which they are based – and to date, all those assumptions favour polluters rather than the planet. What this means is, in the future, as the environment worsens, emissions will have to be cut faster. Most of the studies looking at this in detail focus on one certainty – there will have to major changes to lifestyles in order to make changes in emissions happen quickly.
The question is then, where are the carbon emissions in your daily life?
The graphs below are from a study which maps the total amount of carbon in the UK economy. Not just the fuel that is burned; it considers the ‘embedded carbon’ in imported goods too.
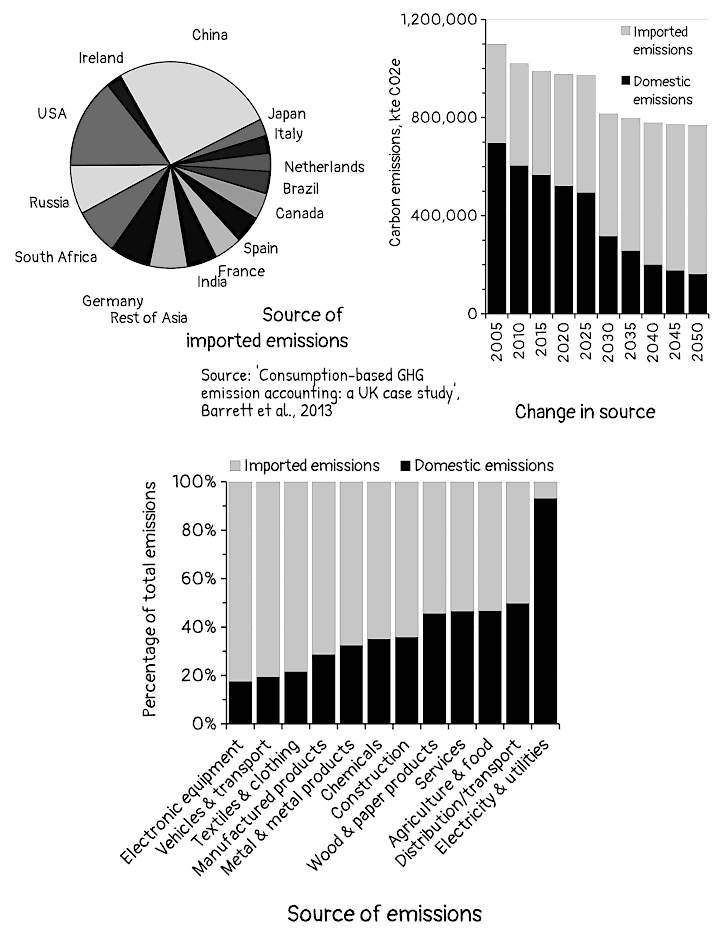
The top-left graph shows where the imported carbon comes from – the fifteen biggest sources of imported goods. China is a quarter; but the USA, Russia, and Brazil, three currently ‘climate sceptic’ states, represent another quarter of emissions. If we are to cut emissions to zero then countries we import from have to cut to zero too. Yet if certain states who we depend upon for certain imports refuse, what then?
The top-right graph shows the balance of ‘domestic’ to ‘imported’ emissions, based on a projection of future changes in the economy. Domestic carbon is reducing because of falling North Sea production. What happens instead is that we import carbon from elsewhere.
The graph at the bottom breaks this down into specific sectors – showing how unequal that split is. Clothing, technology, and manufactured goods, all key parts of our modern lifestyle, have a carbon footprint where 75% of it takes place abroad. Even food, because of Britain large imports of fruit and vegetables, has most of its impact abroad.
The simplistic answer would be, “make it here”. Two problems there: Though the cost of building it all is an issue, the greatest obstacle are international intellectual property laws – we can’t just copy other people’s stuff, so we’d have to quite literally re-invent the wheel or get sued by foreign states; More significantly ‘re-shoring’ those things would mean expending a lot of carbon emissions here – building those new manufacturing plants. Even if we used green electricity for that, the concrete and other raw materials (few of which we have here so they would have to be imported) would also result in greater emissions to make compared to carrying on importing them.
“Imagine a town that suffers from a lack of water. What's more, some real estate magnate owns all the surrounding land and has the mayor in his pocket, so townsfolk cannot simply build new wells. If one were to assemble a group of townsfolk to dig a new well anyway, in defiance of the law, then that would be direct action. But if one were to have them blockade the mayor's house until he changed his policy, that would certainly not be. It might be far more militant than writing petitions or letters or lobbying, but it's just another version of the same thing: an appeal to the powers that-be to change their behaviour. It still recognizes the authority a real direct actionist would reject.”
David Graeber, ‘Direct Action: An Ethnography’ (2009)
There comes a point at which we have to be honest and say there is only one solution: “Having less stuff”. No one can press that argument today because no mainstream political party, not even the Greens, will make that case. The default argument today is for a ‘Green New Deal’ policy that tries to run the existing growth economy on green energy – even though there’s no proof that can work.
If the political system cannot or will not accept the reality of our position, abdicating their obligations under the (alleged) ‘social contract’, then we will just have to create our own solutions – and ‘dare them’ to stop us.
Let’s start by thinking about housing:
Most measures of household energy only consider where the heat is lost from a house. This diagram shows total domestic energy use when you add-in hot water and electrical appliances too.
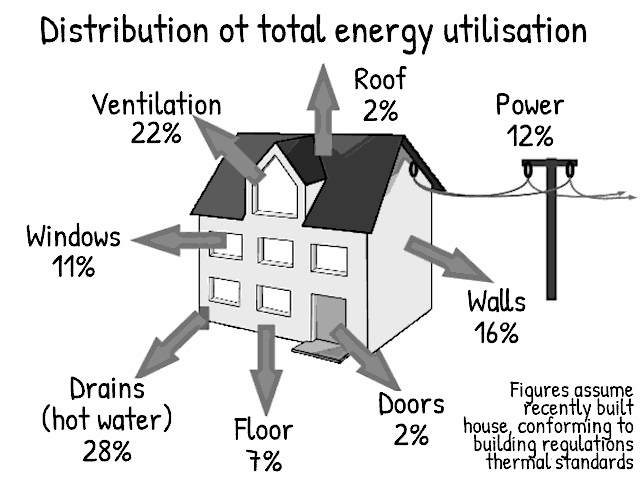
‘Ventilation’ is a fifth of the loss, but the total size of that is set by the volume of the house: smaller home, smaller loss. Hot water, which ends up in the drains, also depends on the type of lifestyle the house occupants adopt. The ‘power’ figure is for appliances that require electricity (i.e., not heating uses).
Conventional ‘green’ responses to heat loss assume that more insulation will solve the problem. What this simple argument ignores is that insulation is a diminishing return – in the end it uses more energy to add the insulation than it would save over its lifetime.
‘Passivhaus standards’, which are not significantly more than the best UK standards, are already set at those maximum limits for efficient insulation – you can’t improve on them.
Curious then that few bother about the alternative strategy: The average house in Britain is heated to between 21°C and 22°C. Every 1°C that is reduced by, down to around 16°C, saves approximately 10% on the heating requirements. Reduce the heating level to 16°C, and put an extra layer of clothing on your body, and you may halve the space heating use. Likewise, reducing the hot water temperature to around 60°C could save a quarter there too.
While green campaigns obsess about household energy consumption, in reality it isn’t that significant in terms of all consumption. Many studies have shown that ‘green’ households do not have a significantly lower impact because, as mostly middle class households, they already consume above median levels. All that ‘green’ practices do is bring that excess down toward the median value.
Why do ‘green’ lifestyles not come out better than those of poorer households? The reality is that ‘heating’ is only one of a number of activities that you do in your life. When we look at the carbon footprint of all those other activities it puts the significance of home heating into a more sober perspective.
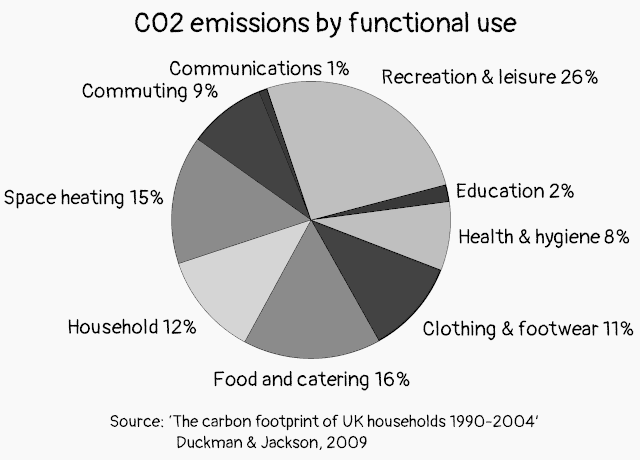
This pie chart shows the carbon footprint of the activities in the average lifestyle. Note how food and recreation have a greater impact than home heating. The values in that chart are actually pretty vague, because they vary so much between different households depending upon their level of affluence – and in total the richest households can use multiple times more than the poorest.
“We have always lived in slums and holes in the wall. We will know how to accommodate ourselves for a time. For, you must not forget, we can also build. It is we the workers who built these palaces and cities here in Spain and in America and everywhere. We, the workers, can build others to take their place. And better ones! We are not in the least afraid of ruins. We are going to inherit the earth; there is not the slightest doubt about that. The bourgeoisie might blast and ruin its own world before it leaves the stage of history. We carry a new world here, in our hearts. That world is growing this minute.”
Buenaventura Durruti, interviewed by Pierre van Paasen (1936)
Historically religions have always given special status to those who are willingly poor. Jesus was very big on that front [Matthew 19:16-22]. Strange then that ‘green’ campaigners, in their zealous quest to ‘save the planet’, do not elevate the benefits of poverty; but instead stress the need to buy the right goods.
Our lifestyles are a mixture of activities, all of which have significant environmental impacts of their own. Only focussing on one – energy loss from the home – picks up only a small part of that overall package. To have an impact on the whole, you have to look at the whole lifestyle and what it consists of. As outlined in the previous article, ‘green’, because of its compromise of ecological values and consumerism, has failed. We have to move beyond that, to find a truly ecological approach.
The cold hard truth is, “technology cannot save you”. Consumers don’t want to hear that message, because it means abandoning the trappings of a conventional, ‘modern’ lifestyle and seeking a radical alternative – which we’ll explore in the next, concluding article. The reluctance of consumers generally, but the affluent in particular, to relinquish their modern lifestyle means only one thing: We will experience ecological collapse, because the 10% of the people on the planet who cause half the pollution will not change quickly enough.
Many don’t want to hear that message. It also portends the end of that same lifestyle which, paradoxically, they will not give up to avoid that outcome!

There is today, though, an alternative strategy that has the capacity to resolve this impasse – ‘ecological lifeboats’: The idea is that a small group of people start preparing for a low impact, ecologically benign lifestyle today; doing so requires access to land, which for those without access to land necessarily requires they occupy it; and given that these kinds of lifestyle necessarily offend the highly-evolved building codes of complex society, they would have to challenge the legitimacy of spatial development policies too.
In the words of David Graeber, that necessarily means stopping ‘representative’ protest and starting to take direct action to secure those needs – and daring the state to stop you. More significantly though, in terms of Durruti and the struggle for land rights, access to land for subsistence support is the best means to move away from the ‘suicide cult’ of affluent consumerism.
‘Do you want to live, or do you want to watch Netflix?’ Yes, it really is that simple.
Concluding the ‘energy special’, what can we understand about Britain from its energy data?
Why do the Free Range Network do displays about statistics?
It’s because so much of the ecological impact of our ‘modern’ lives is hidden from view. The way the media simplify data is partly responsible; but the actions of both politicians and campaign groups accentuate those failures – by giving an erroneous impression of the world around us to prove their own particular single-issue viewpoint.
What this edition of WEIRD has sought to do is interpret the statistics, to point out the information most ‘green’ commentators fail to see, or ignore; that there is one factor consistently missing from most commentaries and the statistics on energy – lifestyle & affluence.
Government departments commission research all the time; and much of that research is publicly available if you dig deep enough. Practically though certain research studies get buried deeper than others.
The Dept. of the Environment, Food and Rural Affairs (DEFRA) carried out research about a decade ago on ‘embodied carbon’ – the carbon emissions that are created when goods are manufactured abroad and imported into Britain. Those emissions should be on our ‘bill’ because we benefit from them. What the DEFRA research found rarely gets talked of, and has to all purposes been buried.
A BEIS press release in March 2020 crowed that UK carbon emissions were, “45.2 per cent lower than in 1990”. The provisional figure for 2019 is roughly 350 million tonnes.
Why have emissions fallen that far? Partly it’s fuel switching – we stopped burning coal and started burning gas. An equally significant part of that figure is the ‘off-shoring’ of emissions – moving production abroad and then importing the goods back into the country.
That’s what the DEFRA work found. The study concluded:
“The UK’s full supply chain emissions from consumption are 853MtCO2e. This does not include direct emissions from households as a result of burning fuel for heating and private car use. These accounted for a further 161MtCO2e bringing the total to 1014 Mt CO2e.”
1014MtCO2 corresponds to almost three times the level of emissions which the Government reports under the UN Convention on Climate Change.

As lifestyles becoming increasingly ‘virtual’, the impacts of daily activities become ever-more hidden. For example, a mobile phone or laptop uses electricity. The reality is that 90% to 95% of the life-cycle energy use by that device took place before you took it out of the box. Likewise the Internet, and ‘The Cloud’ of data it serves, are driving yet more energy and resource consumption.
In 2010 it was estimated that the digital networks were responsible for 2% to 4% of global emissions. By 2030 it is estimated it could be 20%.
Though digital electronics is our greatest sink of rare metals and a large source of pollution, perhaps the greatest ‘hidden’ sink of energy and resources, and the largest source of pollution, is the food supply that sustains the consumer lifestyle. Again, the research here comes up with a wide range of answers because of the problems with the available data; but very roughly it takes ten calories to get a calorie of food in the mouth of the average UK consumer. The energy and emissions created by food production are probably around 30% to 40% of an individual’s global ecological footprint.
If food is so significant, why do the media focus on household energy consumption? If the latest fast, wireless, digital technologies are driving a massive increase in global emissions, why are government and businesses making it harder to use the older, wired, analogue predecessors to these systems?
That is the issue which we try to reach through these statistics, and the displays we develop from them.
The data demonstrate that the digital world is NOT more efficient than its analogue predecessor: It’s worse in energy or carbon emissions terms; and the demand by digital technologies for rare metals is driving a mining boom that threatens to globally increase pollution levels, destroy biodiversity, as well as depleting the very resources we need for future ‘sustainable’ technologies.
What’s more, from the worse customer service, to the way automated services make humans to conform to their inhuman interactive standards, the shift to the on-line world is arguably making people ‘mad’ – not only the precariousness of employment as machines take people’s jobs, but also the daily frustrating interactions with on-line technology.
“Environmental problems have become the psychopathology of our everyday life. The anguish of what I will call the ‘ecological unconscious’ has emerged as a deeper imbalance. If psychosis is the attempt to live a lie, our psychosis is the lie of believing we have no ethical obligation to our planetary home.”
This is not new or unexpected. It was foreseen by technology writers in the 1950s and 1960s, such as Jacques Ellul or Jean Baudrillard.
Perhaps the greatest insights came from Theodore Roszak, the originator of ecopsychology. He identified, in the 1990s, the damaging psychological stress caused when our natural lives are expected to function within technological boundaries – excluding the ‘natural’ from our lives. Those observations are being conformed by present-day psychological research on people’s interactions with technology.

In a very real and serious sense then, the ‘digital industrial society’ poses a very specific question: “Do you want to live, or do you want to watch Netflix?” The solution?: We have to stop ‘upgrading’ our lives with technology, and live more simple, less material, directly supported lifestyles with simpler, human-scale machines.
W.E.I.R.D.: THINKING BEYOND TECHNOLOGY – No.3, Samhain 2020
A Free Range Activism Network Publication. Download other editions of ‘WEIRD’ at http://www.fraw.org.uk/frn/weird/index.shtml. Email any comments or feedback to weird☮frăwꞏörĝꞏuk. Issued under Creative Commons BY-NC-SA-4 license; you may freely distribute.